Backing Favourites in Class 1 Races: What Three Years of Data Actually Says By The OutandOutStayer


Every punter has heard the theory. In top-class races, the cream rises. The best horses, the best trainers, the best jockeys — surely the market gets it right at the top level, and surely the favourite is the safest bet in racing?
It's a seductive idea. It's also exactly the kind of idea a disciplined punter should test before putting a penny on it. So I did — three full years of data, every favourite, every top-class race in Britain and Ireland, settled at Betfair SP with commission deducted. No hindsight, no cherry-picking, no "I would have skipped that one."
Here's how I built the test, and what the numbers actually say. Fair warning: if you're hoping for a lazy path to profit, this article will disappoint you. If you want to understand how the market really behaves at the top of the sport, read on.
Building the System in Proform
I use Proform's System Builder for this kind of work, and I want to show you the construction as well as the results — because how you frame a question determines whether the answer means anything.
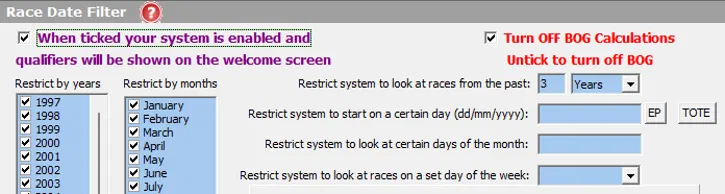
Step 1: The date filter. (Screenshot 1) The system is set to look back 3 years from today, with BOG calculations switched off — I bet exclusively on the exchanges, so best-odds-guaranteed bookmaker prices are irrelevant to me. Every result you'll see here is at Betfair SP, the price real money actually got matched at.
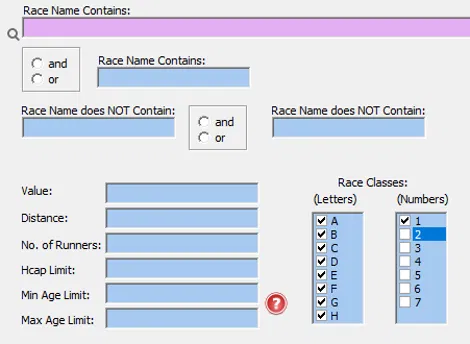
Step 2: The race filter. (Screenshot 2) All race letter classes A–H are ticked, but the numeric class filter is restricted to Class 1 only. Nothing entered in "Race Name Contains" — no course bias, no meeting bias. Every Class 1 race in Britain and Ireland over the period qualifies: Group and Grade 1s, 2s and 3s, Listed races, and the big Class 1 handicaps.
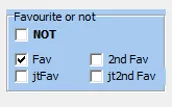
Step 3: The selection filter. (Screenshot 3) One box ticked: Fav. The straight market favourite. Not the joint favourite, not the second favourite — the horse the market says is most likely to win. This is the purest possible test of the theory.
Step 4: The breakdown. (Screenshot 4) Results split by Race Type — Turf, All-Weather, Chase, Hurdle and National Hunt Flat — because "top-class racing" is really five different sports wearing one rulebook.


Two thousand two hundred and forty-four bets. More than one in three won. And you'd have lost 140 points.
Notice the A/E figure in the Proform output: 0.96 overall. Actual winners divided by market-expected winners. The market expected roughly 873 favourites to win; 838 did. Favourites in top-class races win almost exactly as often as their prices imply — slightly less, in fact — and once you subtract commission, the theory is dead on arrival as a blind system.
Not All Class 1 Races Are Created Equal
Here's where it gets interesting. "Class 1" is an umbrella, not a grade — it spans everything from a Champion Stakes to a 20-runner Ayr Gold Cup. Treating those as one population hides the real story, so I exported the full results and broke the 2,244 races down by what they actually were:
| Grade | Bets | Winners | Strike Rate | P/L (pts) | ROI (Betfair) |
|---|---|---|---|---|---|
| Group/Grade 1 | 359 | 152 | 42.3% | −10.51 | −2.93% |
| Group/Grade 2 | 438 | 184 | 42.0% | −4.87 | −1.11% |
| Group/Grade 3 | 469 | 183 | 39.0% | −24.76 | −5.28% |
| Listed | 793 | 278 | 35.1% | −35.54 | −4.48% |
| Other Class 1 (mostly handicaps) | 185 | 41 | 22.2% | −39.01 | −21.09% |
And now the picture sharpens beautifully:
- The higher the grade, the better the favourite performs. Strike rate climbs from 22% in Class 1 handicaps to 42% at the very top, and the losses shrink from a ruinous −21% to a near-break-even −3%.
- The theory is directionally right. The market is sharper at the top. Form is more exposed, the horses are more reliable, and the favourite is more often the right answer.
- But directionally right is not profitable. −2.93% after commission is a slow bleed, not an edge. You'd have backed 359 Group 1 favourites over three years and paid roughly ten points for the privilege.
The real graveyard in the data is the bottom of Class 1: favourites in top-class handicaps lose a brutal 21p in the pound. If this article changes one habit, let it be this — stop treating "it's a Class 1 race" as a mark of quality when the race is a 20-runner handicap. The market knows far less there, and it prices that ignorance into short favourites anyway.
Digging Into the Group 1 Sample
The 359 genuine Group 1 favourites are the most interesting slice, so I cut them a few more ways.
By race type:
| Bets | Winners | Strike Rate | ROI | |
|---|---|---|---|---|
| G1 Turf (Flat) | 147 | 62 | 42.2% | +9.3% |
| G1 Hurdle | 107 | 51 | 47.7% | +5.3% |
| G1 Chase | 100 | 38 | 38.0% | −27.5% |
Two apparent positives and one horror show. Group 1 chase favourites are the worst blind bet in the entire dataset outside the handicaps — negative every single year of the sample. It makes intuitive sense: fences introduce a failure mode that has nothing to do with ability. The best horse in a Champion Hurdle usually gets a clean look at every flight; the best horse in a Gold Cup has thirty opportunities to end its race at the whim of physics. The market prices class; it cannot price a mistake at the second-last.
By price band (all G1s):
| BSP Band | Bets | Strike Rate | ROI |
|---|---|---|---|
| 1.01–1.50 | 28 | 64.3% | −15.5% |
| 1.51–2.00 | 93 | 55.9% | −3.1% |
| 2.01–3.00 | 132 | 40.9% | −2.7% |
| 3.01–5.00 | 98 | 28.6% | +4.4% |
| 5.00+ | 8 | 0.0% | −100% |
The very shortest favourites — the "certainties" — are the worst value on the board. Horses sent off below 1.50 in Group 1s won 64% of the time, but their prices demanded they win more like 74%. That gap is the cost of the crowd's love affair with superstars. When everyone knows a horse can't be beaten, the price stops reflecting probability and starts reflecting sentiment.
Now the Uncomfortable Part
At this point a less disciplined analyst would write the conclusion you can already see forming: "Back Group 1 turf and hurdle favourites, avoid the chases, and you've got a +7% ROI system." Roughly 250 bets a year, positive return, job done.
I'm not going to write that, because I checked the years:
| Group 1 favourites | 2023 (part) | 2024 | 2025 | 2026 (part) |
|---|---|---|---|---|
| ROI | −21.9% | +19.6% | −10.5% | −20.5% |
One year — 2024 — carries the entire positive story. G1 turf favourites returned +32.8% in 2024 and were negative or marginal in every other year. The G1 hurdle "profit" is the same shape: +14.4 points in 2024, losses in 2023, 2025 and 2026. Strip out one golden year and the whole edge evaporates.
This is precisely how bad systems get born. Someone runs three years of data, finds a profitable slice, and sells it as an angle — never asking whether the profit is a pattern or an accident of one season. With sample sizes of 100–150 bets per slice, a single year where a few 4.5-shots obliged (Kalpana, Charyn and Content at big-field Ascot and York prices did a lot of heavy lifting in 2024) is enough to paint a false signal. The 3.01–5.00 price band showing +36% on G1 turf? Eighteen winners from fifty bets. That's not an edge; that's a coin that landed kindly.
The honest read of 359 Group 1 favourites is this: A/E of roughly 0.97, ROI of −3%, and no sub-segment whose profit survives year-by-year inspection. The market at the top of the sport is about as efficient as betting markets get.
What the Disciplined Punter Takes Away
- The Group 1 favourite is the best blind bet in racing — and it still loses. 42% strike rate, −3% ROI. If the sharpest market in the sport can't be beaten blind, no market can. Anyone selling you a "back the jolly in the big races" system is selling you a slow leak.
- Grade quality is real; profitability is not. Favourites perform progressively better as race quality rises. Use that as context — a Group 1 favourite is a far more reliable banker in your multiples or a far safer anchor in place markets than a Class 1 handicap favourite — but not as a system.
- Group 1 chase favourites are structurally bad value. −27% over three years, negative in every year. The market persistently underprices jumping risk at the top level. If there's a genuinely durable finding in this data, it's on the lay side, not the back side — though at short prices, the liability arithmetic of laying needs its own article.
- Never trust a three-year total without seeing the years. The single most important table in this piece is the year-by-year breakdown, and it's the one most system-sellers will never show you.
- Beat the price, not the race. The route to profit in Group 1s isn't backing favourites; it's identifying the races where the favourite is wrong — where sentiment, hype or a superstar's reputation has compressed the price below the horse's true chance, and value has leaked to the second or third in the market. The 1.01–1.50 band losing 15% tells you exactly where that leaked value comes from.
The market is a formidable opponent at the top of the sport. Respect it, measure it, and only bet when you can show — with data, across multiple seasons — that you know something it doesn't.
Methodology: all Class 1 races in Britain and Ireland, July 2023 – July 2026, straight market favourites only, settled at Betfair SP with 2% commission deducted from winners. System built in Proform System Builder; grade classification and sub-analysis from the full race export. Past results are not a prediction of future returns — that's rather the point of the article.